Lesson 8: Trendlines and Patterns
In trading, recognizing trendlines and patterns is just as crucial as understanding support and resistance. Price often moves within channels, bouncing between trendlines, forming patterns that indicate potential trade opportunities. Learning to identify these patterns will allow you to anticipate market movements and refine your trading strategy.
Understanding Trendlines and Channels
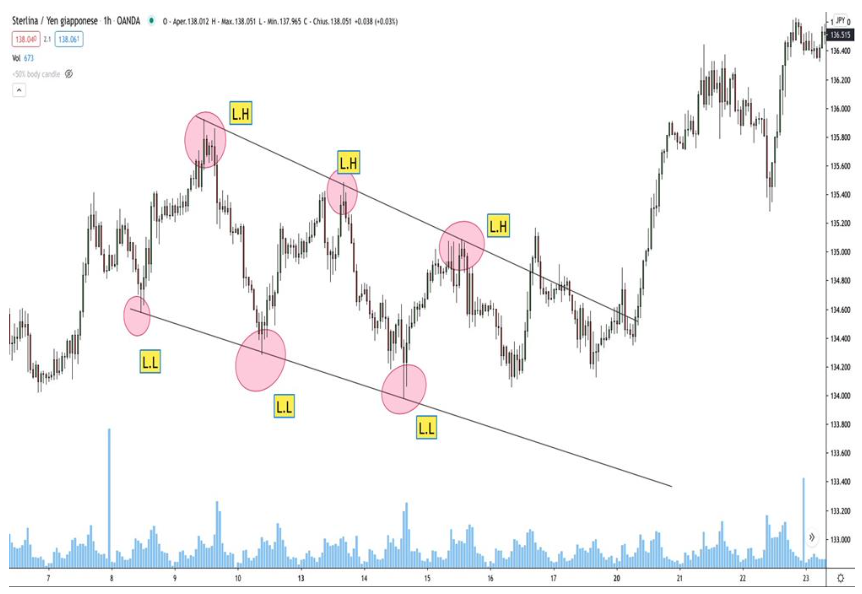
Trendlines are diagonal support or resistance levels that price respects within an uptrend or downtrend. These channels are composed of:
Lower Lows (L.L.) and Lower Highs (L.H.) in a downtrend.
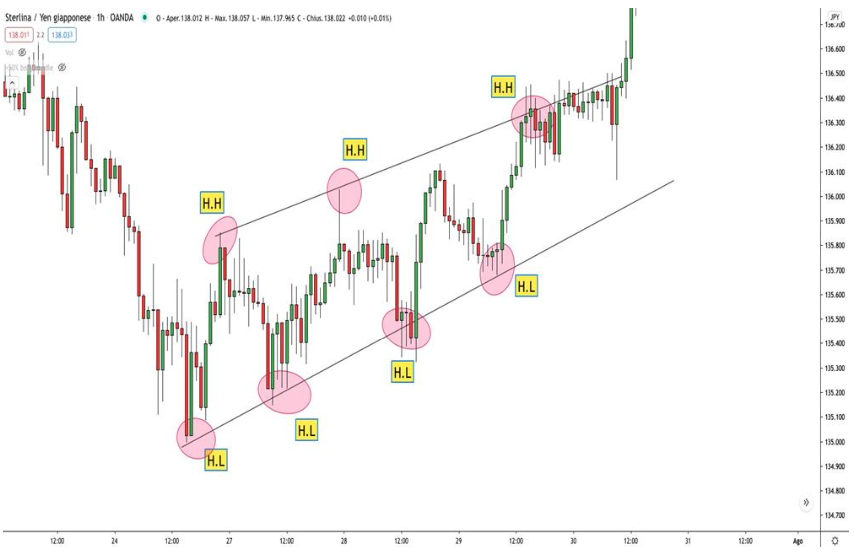
Higher Highs (H.H.) and Higher Lows (H.L.) in an uptrend.
Recognizing Trade Entry Points
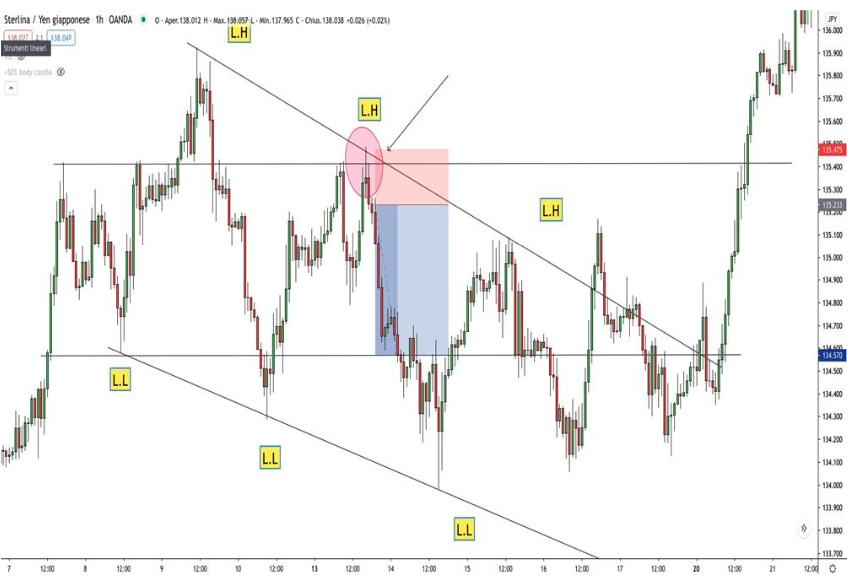
A perfect trade entry within a trendline setup involves waiting for a confirmation candle. Let’s analyze an example:
Downtrend Channel: If the price reaches a Lower High (L.H.) and a reversal candle appears, we wait for confirmation before entering a sell order.
Uptrend Channel: If the price reaches a Higher Low (H.L.) and forms a reversal candle, we prepare to enter a buy order.
Placing Stop-Loss (S.L.) and Take-Profit (T.P.) correctly is crucial. S.L. should be slightly beyond resistance or support, and T.P. should target the opposite trendline.
Key Trading Patterns
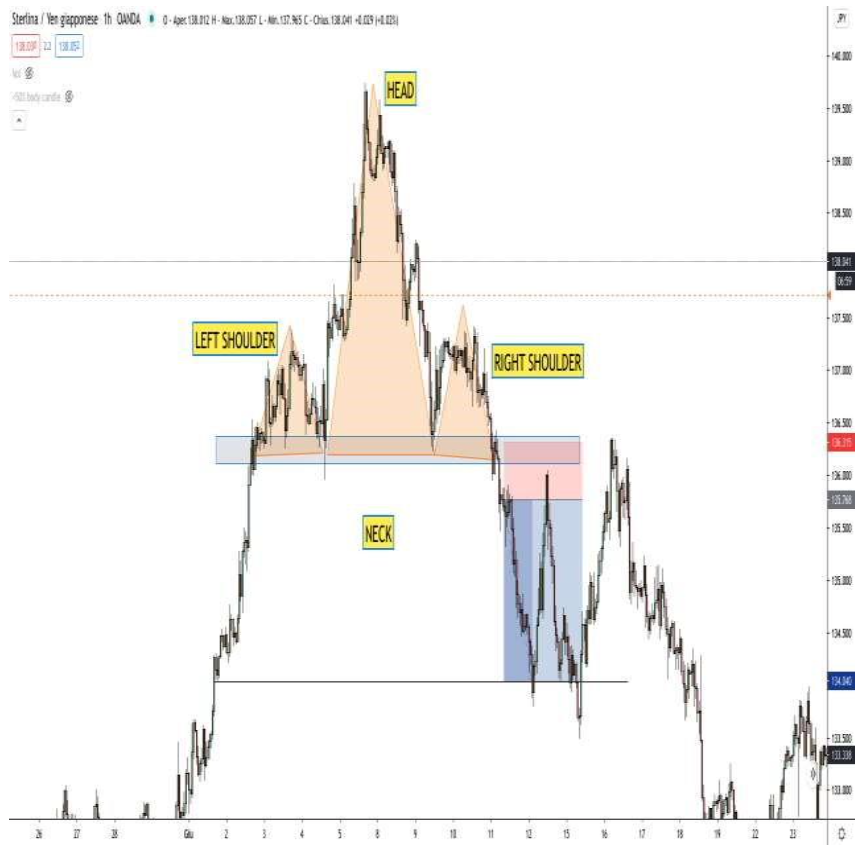
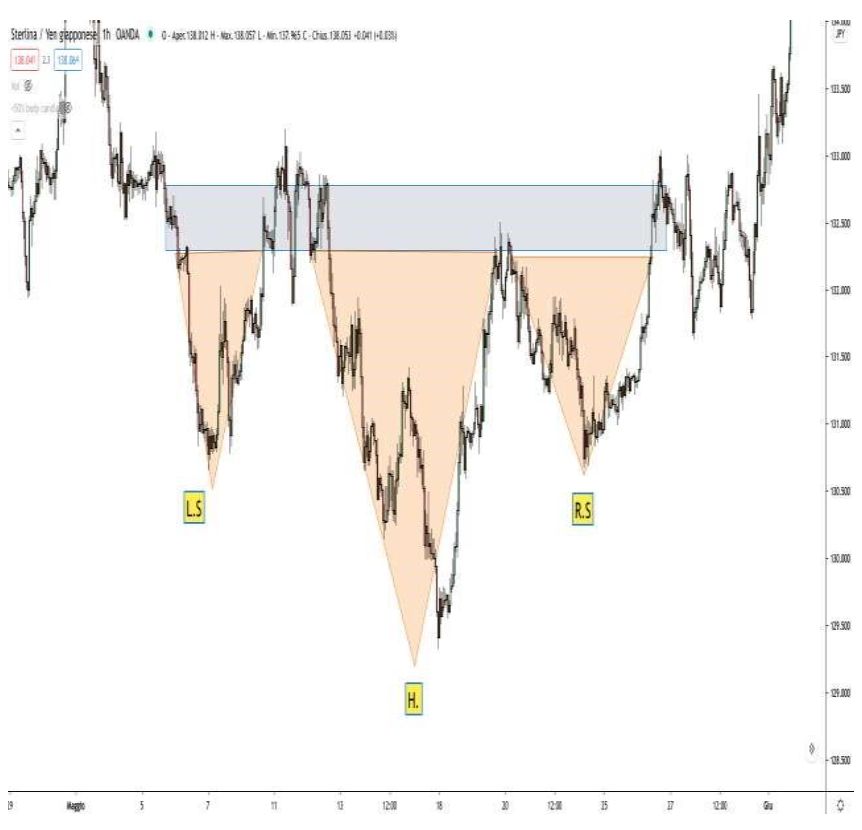
Head and Shoulders Pattern
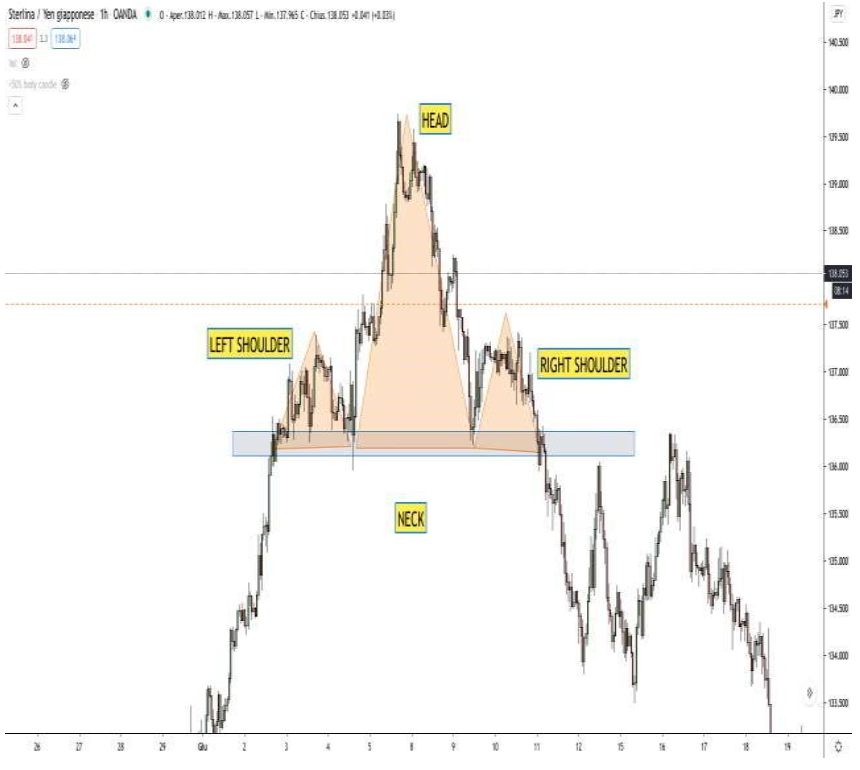
This reversal pattern consists of:
Left Shoulder
Head (highest peak)
Right Shoulder
Neckline (support level)
Traders should only enter after the neckline is broken, followed by a retest for confirmation.
The inverse Head and Shoulders pattern works similarly but signals a potential bullish reversal.
Horizontal Channel
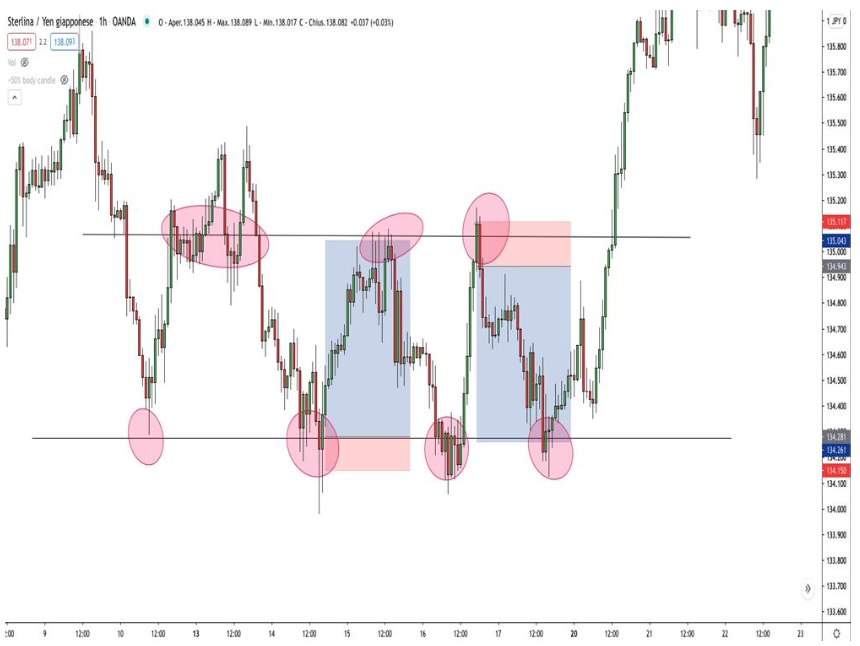
A horizontal channel forms when price oscillates within a defined range. The price will bounce between support and resistance multiple times.
Buy at support and Sell at resistance while maintaining tight Stop-Loss placements.
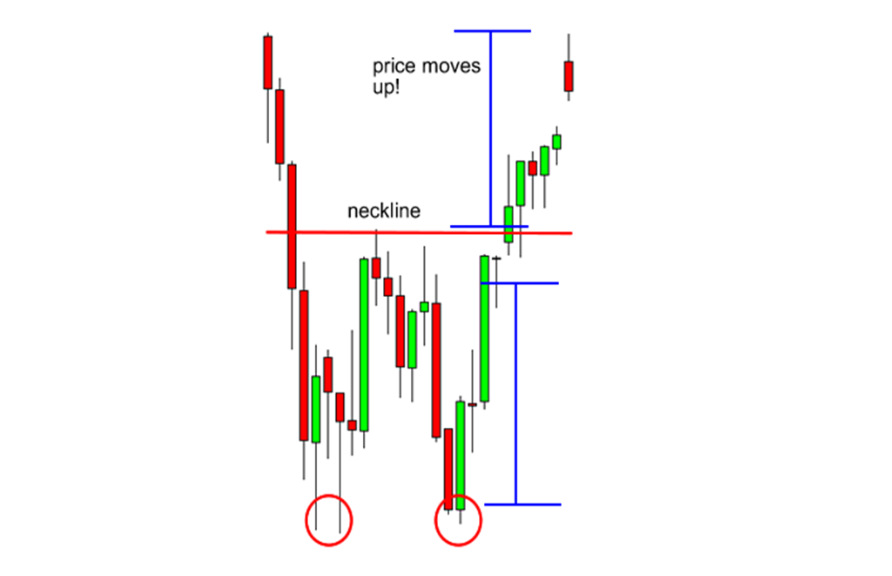
Double Top and Double Bottom
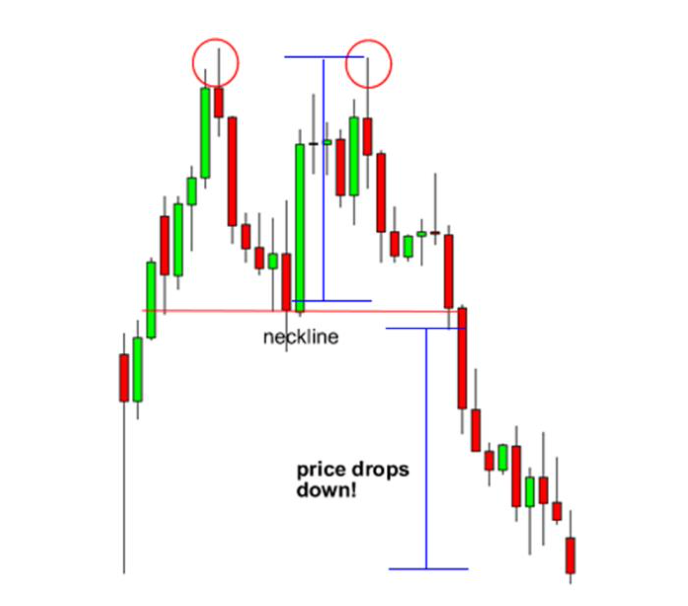
Double Top:
Appears at resistance levels, signaling a potential reversal.
Entry can be made at the second touch or after the neckline breaks.
Double Bottom:
Forms at support levels, indicating a bullish reversal.
Entry is best made at the second touch or after the neckline breaks.
Trend Breakout Strategy
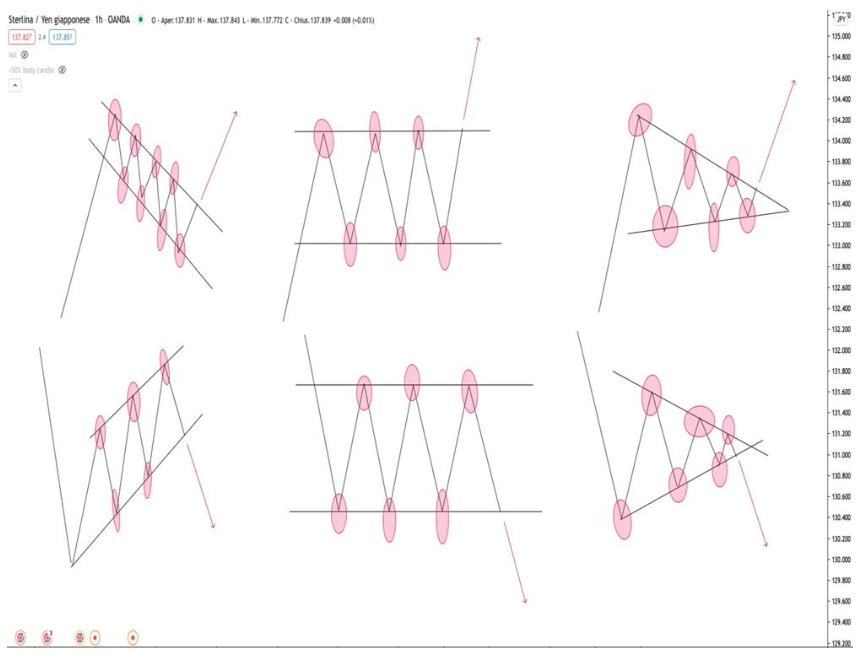
Sometimes, a trendline will break, signaling the formation of a new trend. This happens when the price moves outside its established channel.
Entry Strategy:
Wait for a trendline break.
Confirm with a retest of the previous trendline.
Look for an indecision candle as confirmation before entering.
Higher time frames (1H, 4H, or Daily) provide stronger breakouts.
Important: If a retest doesn’t occur, consider skipping the trade to avoid false breakouts.

Next Steps: Practice on TradingView
To master trendlines and patterns, open TradingView and start practicing chart analysis. Identify channels, draw trendlines, and recognize patterns in real-time market data.
Trading is a game of patience, strategy, and psychology. By mastering these concepts, you will improve your ability to execute high-probability trades successfully.
Start Trading
Start trading now with FintekMarkets and join thousands of traders who have already chosen this successful path.


