Lesson 7: Support and Resistance
Support and resistance levels are crucial concepts in technical analysis. These are price levels where the market historically tends to reverse or consolidate before continuing its movement. Recognizing these levels allows traders to make informed decisions about entry and exit points.
Understanding Support and Resistance
-
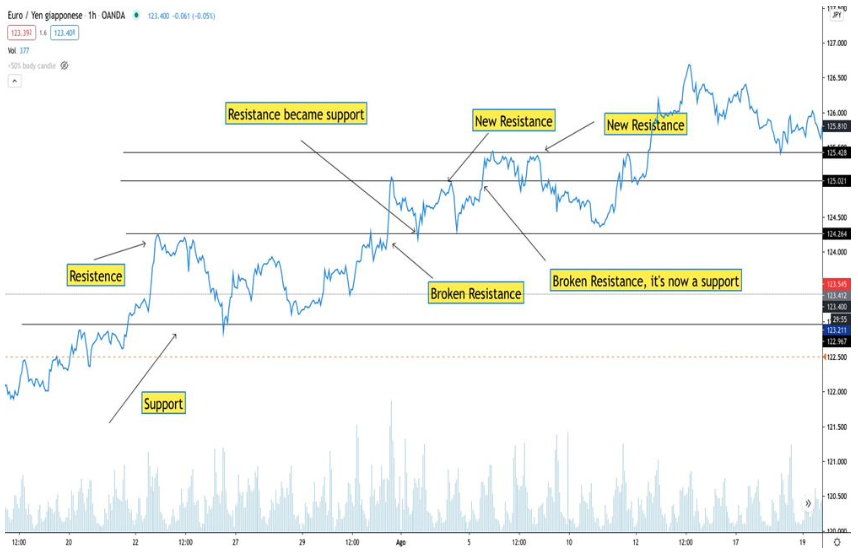
Support: A price level where the asset tends to stop falling and may start rising. It acts as a “floor” that prevents further decline.
-
Resistance: A price level where the asset tends to stop rising and may start declining. It acts as a “ceiling” that prevents further ascent.
When the price approaches these levels, traders observe whether it will bounce back or break through the level. If a resistance is broken, it often becomes a new support level and vice versa.

Identifying Support and Resistance Levels
To accurately determine these levels:
-
Use a Line Chart First: Start by identifying areas where price bounces off multiple times.
-
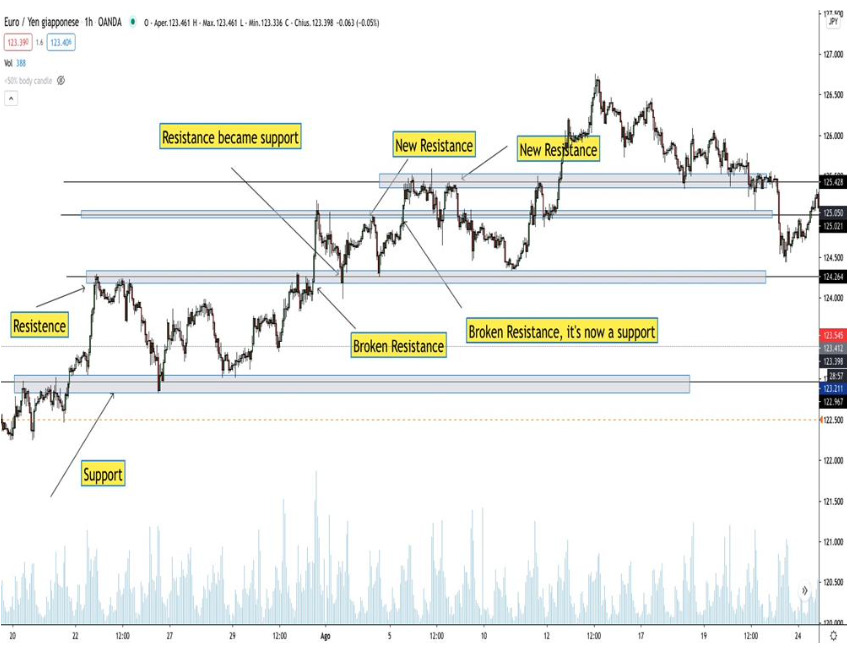
Refine with a Candlestick Chart: Candlestick shadows help confirm precise points of support and resistance.
-
Look for Repeated Touches: The more times a level is tested, the stronger it is considered.
-
Identify Support and Resistance Zones: Instead of a single price level, focus on zones where price action consistently reacts.
Using Support and Resistance in Trading
Once you’ve identified support and resistance levels, you can use them to time your trade entries and exits effectively.
Trading Strategy: Entering Buy and Sell Positions
Support and resistance levels become especially powerful when combined with candlestick patterns. Let’s look at an example:
-
Identifying a Resistance Level:
-
If the price approaches a known resistance level and forms reversal candlesticks like Hanging Man or Shooting Star, this can be a strong sell signal.
-
Entry: Open a sell position.
-
Stop Loss: 15 PIPs above the resistance zone.
-
Take Profit: Near the support zone.
-
-
Identifying a Support Level:
-
If the price approaches a support zone and forms reversal candlesticks like Hammer or Bullish Engulfing Pattern, this can indicate an upcoming rise.
-
Entry: Open a buy position.
-
Stop Loss: 15 PIPs below the support zone.
-
Take Profit: Near the resistance zone.
-
Key Considerations for Effective Trading
-
Higher Time Frames for Stronger Levels: Always draw support and resistance zones using 1H, 4H, or Daily charts for more reliable levels.
-
Enter on Lower Time Frames: Once major levels are identified, look for entries on 30-minute or 1-hour charts.
-
Patience is Key: Always wait for candlestick confirmation before entering a trade.
-
Risk Management: Proper stop-loss placement is crucial to protect capital from sudden price movements.
By mastering support and resistance, combined with candlestick analysis, you gain a strategic edge in the market. In the next lesson, we will explore advanced trading patterns that enhance your ability to predict price movements with confidence.

Start Trading
Start trading now with FintekMarkets and join thousands of traders who have already chosen this successful path.