Each candle has its own story and significance. Recognizing different candlestick patterns is essential as they indicate market sentiment and potential trend reversals. While memorizing their names is optional, understanding their meanings is crucial. Let’s explore the key candlestick formations.
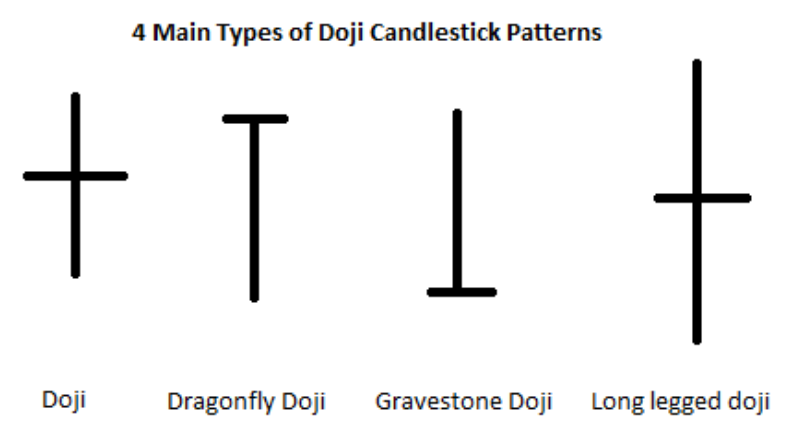
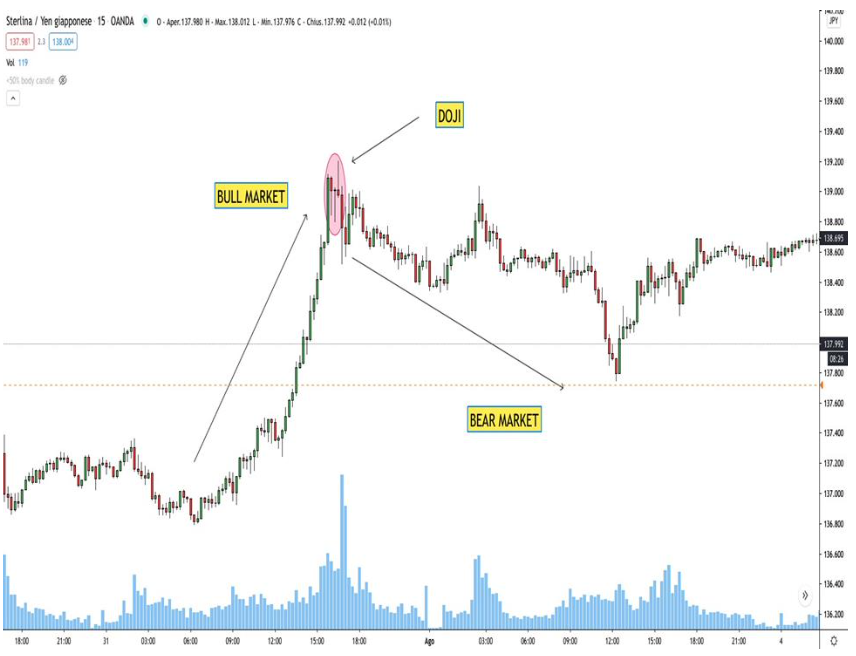
A DOJI candle is characterized by a small or nonexistent body, with long upper and lower shadows. It signifies market indecision, where neither buyers nor sellers dominate. There are four types of DOJI candles:
If a DOJI appears after a prolonged uptrend or downtrend, it may indicate a potential reversal.
Always wait for confirmation from the next candle before making a trade decision.
Similar to the DOJI, the Spinning Top has long shadows and a small body, also indicating market indecision. It often appears at the end of a trend and may suggest a potential reversal.
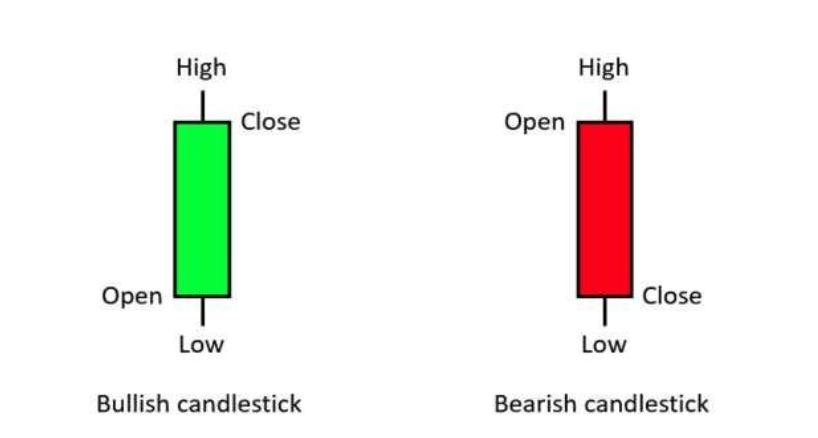

A Hanging Man candle forms at the end of an uptrend and signals a possible trend reversal. It has a small body with a long lower shadow, suggesting sellers are starting to take control.
If red, it strongly indicates a potential downturn.
Wait for confirmation before acting.
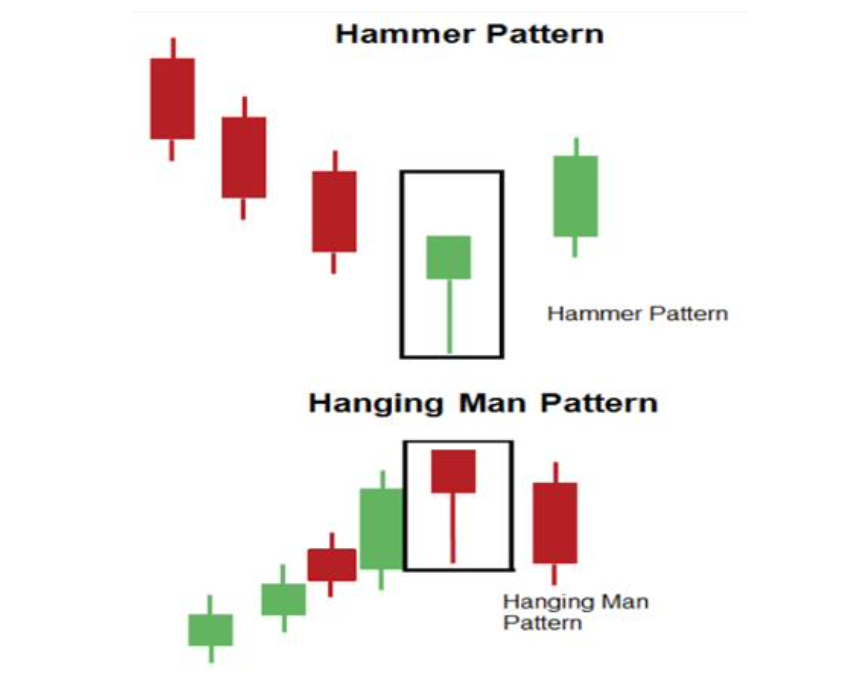
A Hanging Man candle forms at the end of an uptrend and signals a possible trend reversal. It has a small body with a long lower shadow, suggesting sellers are starting to take control.
If red, it strongly indicates a potential downturn.
Wait for confirmation before acting.
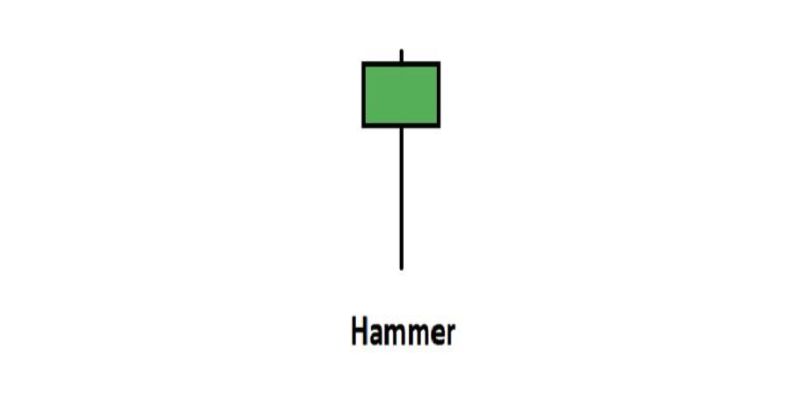
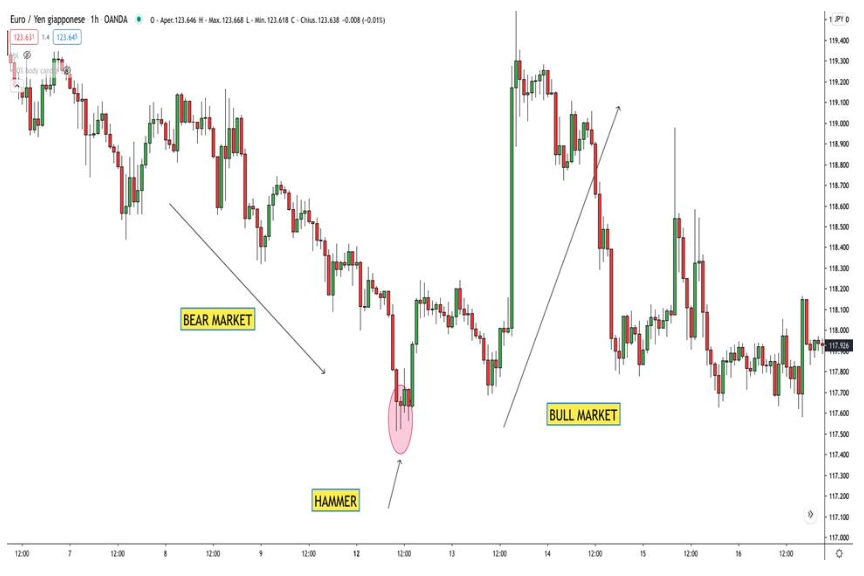
The Hammer looks similar to the Hanging Man but signals the opposite—a possible upward reversal after a downtrend.
Its shadow points downward, showing that buyers are stepping in.
Confirmation is required before entering a trade.


The Shooting Star indicates a downward trend. It has a long upper shadow and a small body, signifying that buyers pushed prices up, but sellers regained control.
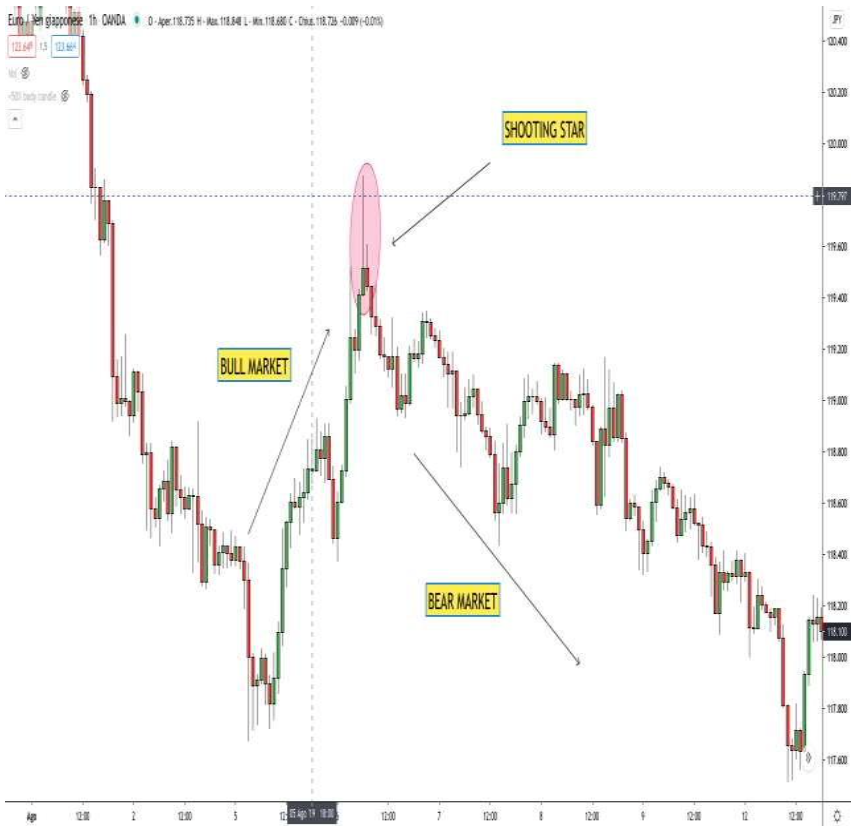
The Shooting Star indicates a downward trend. It has a long upper shadow and a small body, signifying that buyers pushed prices up, but sellers regained control.

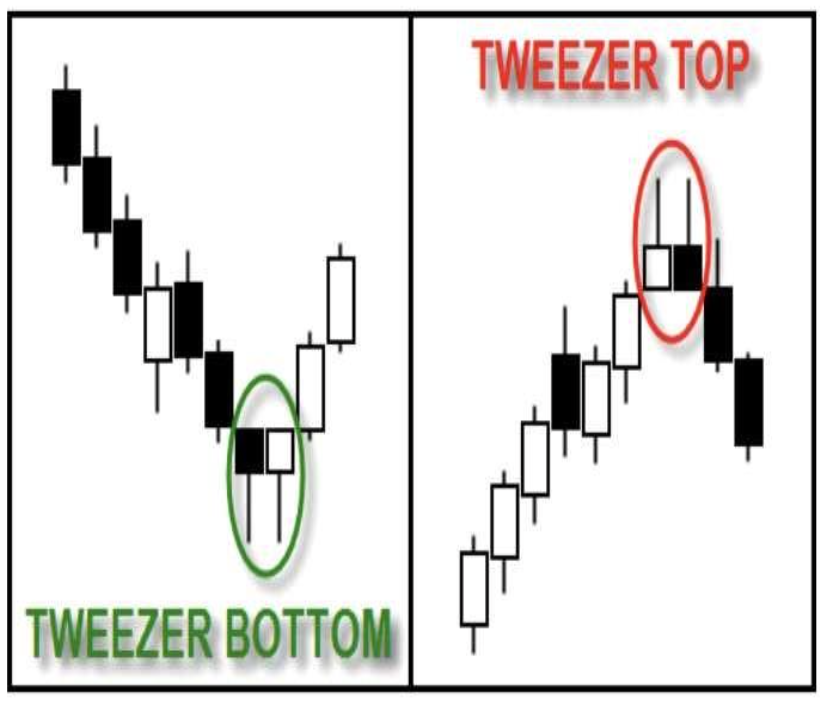
This pattern consists of two consecutive candles with almost identical highs or lows. It suggests a possible trend reversal:
Tweezer Tops signal a bearish reversal.
Tweezer Bottoms indicate a bullish reversal.
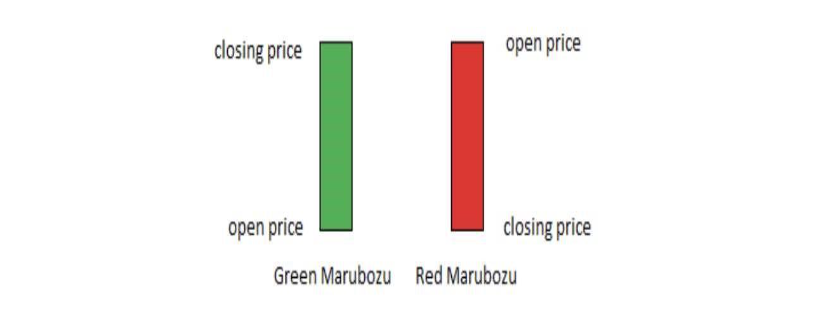
A Marubozu is a strong candle with no shadows, indicating clear market dominance:
A green Marubozu signals strong buying momentum.
A red Marubozu suggests powerful selling pressure.
This candle is more reliable on higher time frames (1H, 4H, 1D).
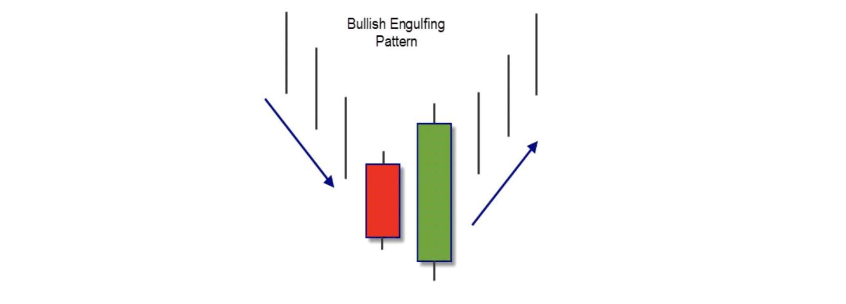
Occurs at the end of a downtrend when a green candle fully engulfs the previous red candle, signaling a potential reversal. Confirmation is necessary.
The opposite of the Bullish Engulfing Pattern. Found at the end of an uptrend when a red candle completely engulfs the previous green candle, indicating a shift to bearish momentum.

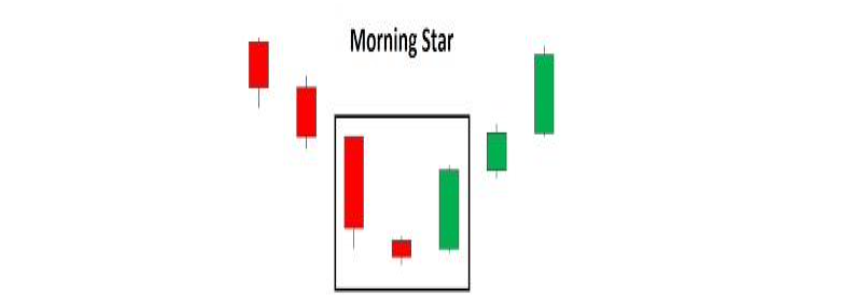
This is a three-candle formation at the end of a downtrend:
A long bearish candle.
A DOJI (indicating indecision).
A strong bullish candle covering 50%-70% of the first candle.
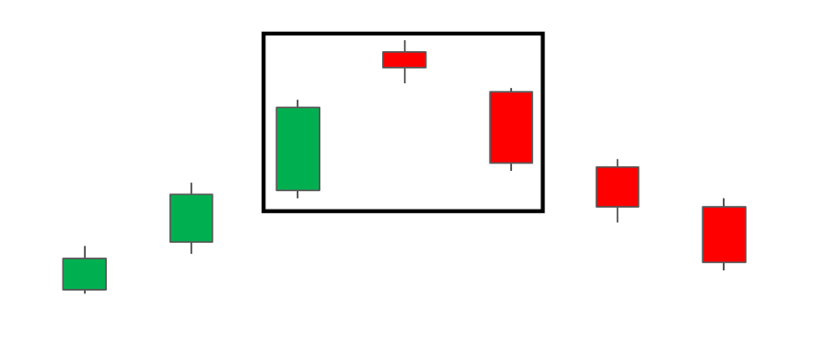
The opposite of the Morning Star, appearing at the end of an uptrend. It consists of:
A long bullish candle.
A DOJI.
A strong bearish candle covering 50%-70% of the first candle.
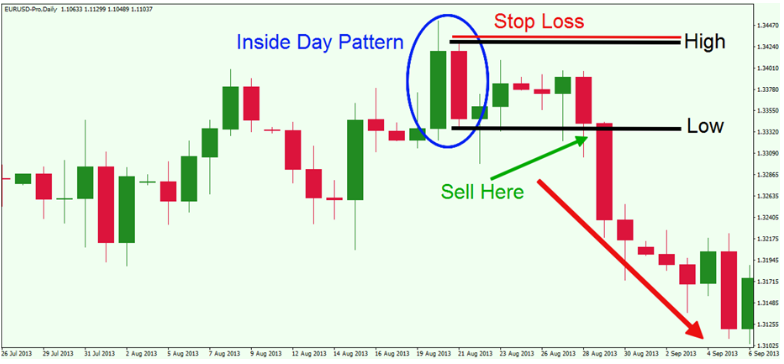
A simple but powerful pattern where a large mother candle engulfs the next few candles. When the mother candle is broken, price action often follows the breakout direction.
Start trading now with FintekMarkets and join thousands of traders who have already chosen this successful path.

Fintekmarkets Ltd with registered office in Fortgate Offshore investment and legal services ltd. Ground Floor, The Sotheby Building, Rodney Village, Rodney Bay, Gros-islet, Saint Lucia, registered by the International Business Companies under company number 2024-00577. Fintekmarkets Ltd is acting in accordance of the International Bussiness Company’s Act.


Subscribe to our newsletter to stay up-to-date with the latest news and updates from Fintek Markets
FINTEKMARKETS LTD Saint Lucia – Copyright © 2024
Trading forex, CFDs, and other leveraged products involves significant risk of loss and is not suitable for all investors. Leveraged trading magnifies both potential gains and losses, and clients may lose more than their initial investment. Before trading, consider your risk tolerance, financial experience, and investment objectives. Past performance is not indicative of future results. Be aware that financial regulations and consumer protections vary by country, and our products may not be available in all jurisdictions. Ensure compliance with your local laws before engaging in trading activities.
Fintekmarkets Ltd with registered office in Fortgate Offshore investment and legal services ltd. Ground Floor, The Sotheby Building, Rodney Village, Rodney Bay, Gros-islet, Saint Lucia, registered by the International Business Companies under company number 2024-00577. Fintekmarkets Ltd is acting in accordance of the International Bussiness Company’s Act.
CFDs are complex instruments and come with a high risk of losing money rapidly due to leverage. 74% of retail investor accounts lose money when trading CFDs with this provider. You should consider whether you understand how CFDs work and whether you can afford to take the risk of losing your money.
Forex and CFD markets can be volatile and may result in rapid price changes. These price changes can cause your position to be liquidated quickly, particularly if you are using high leverage. Market conditions can also lead to slippage, in which your order is filled at a different price than expected.


